| The multitenant distribution (MTD) warehouse segment is generally described as warehouse/distribution buildings with small-to-medium footprints (typically 200,000 square feet or smaller), often with column spacing of 40 feet by 40 feet and clear height under 24 feet. Traditionally, tenants of these facilities tended to be local and regional distributors. More recently, the rapid growth of eCommerce has given rise to a new type of tenant who needs to support ever-tighter delivery commitments.
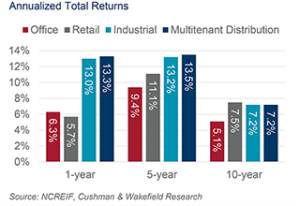
Healthy demand and tight supply has made MTD among the best performing commercial real estate segments. In 2017 MTD boasted the highest year-over-year rent growth of any property type. Further, its value on a per-square-foot basis is approximately 20% higher than the broader warehouse market with pricing continuing to increase. This segment realized a total return of 13.3% in 2017, well ahead of the overall commercial real estate return of 7.0%. On a one-, five-, and 10-year basis, MTD properties have outperformed the broader commercial property market and other industrial segments. |
|
Dominant Share of Investment Universe and Still Increasing in Importance
MTD comprises the largest share of U.S. industrial product and an even greater share of industrial properties with income-generating promise that attract the attention of institutional buyers. The U.S. industrial market can be divided into MTD, bulk distribution, owner/user, manufacturing, and flex. Historically, investors have targeted the bulk distribution, MTD, and flex segments for their industrial real estate allocations because other industrial segments are largely owner-occupied or have limited alternative tenancies, making them less attractive investments.
Tenant demand for MTD is expected to grow more than any other segment. Buildings near population centers that support efficient freight movement—reducing the time, distance and cost of both inbound and outbound transportation while improving online and omnichannel service levels—are increasingly being sought as “final mile” nodes for retail supply chains. |
#1
|
BOASTS THE HIGHEST YEAR-OVER-YEAR INDUSTRIAL RENT GROWTH AT
6.2% IN 2017 |
|
39%
|
| COMPRISES 39% OF THE 14.3 BILLION SQUARE FOOT U.S. INDUSTRIAL MARKET |
|
|
|
|
Short-Term and Long-Term Leader
In both the short and long term, MTD has recorded the strongest rent growth and highest occupancy rates of all commercial real estate segments. At year-end 2017, MTD boasted the highest year-over-year rent growth of any property type at 6.2%, compared to 4.3% for bulk distribution, 4.2% for office, and 2.8% for retail shopping centers. Current occupancy rates for MTD (97.3%) are higher than the bulk distribution segment (94.8%), though both are at historic highs.
Over the past decade, national rent growth for MTD has averaged 2.1% per year, while the average for bulk distribution was 1.5% per year. Average occupancy rates (94.9%) were also higher compared to both bulk distribution and overall industrial product (93.1% and 91.9%, respectively). |
59%
|
| ACCOUNTS FOR 59% OF THE INVESTMENT-GRADE UNIVERSE OF U.S. INDUSTRIAL PRODUCT |
|
1-5-10
|
RETURNS HAVE OUTPERFORMED
OTHER CRE SEGMENTS ON A ONE-, FIVE, AND 10-YEAR BASIS |
|
|
|
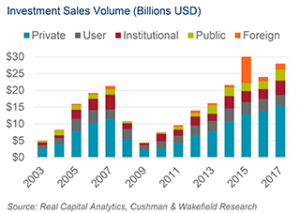
| The sources of capital flowing into MTD have changed as the segment has become more mainstream and more appealing to a broader base of investors. The inflow of foreign capital in recent years, which historically targeted office, retail, and hotels in gateway markets has shifted into MTD. In 2007, private investors comprised 55% of all transactions, and offshore capital accounted for only 4.7% of investment in MTD. By 2015, however, the share of private investors slipped to 43%, while foreign buyers increased their share by more than fivefold to 27%.
Strong investor demand has pushed up prices and compressed cap rates. MTD pricing rose to $85 per-square-foot in 2017—a 2.4% increase from 2016 and a 13.3% increase from the prior peak of $75 per-square-foot reached in 2007. At year-end 2017, weighted average cap rates were 6.0%, 250 basis points below the peak of 8.2% recorded in 2010. In 2017, MTD achieved a 5.4% income return and a 7.9% appreciation return for a total return of 13.3%, well ahead of the overall commercial real estate return of 7%.
Over the past decade, MTD has provided better returns than a number of commercial real estate segments. Strong rent growth, still attractive income returns and sustained investor demand will continue to drive outperformance in the coming years. Secular support for MTD from the ongoing transition to eCommerce means that even in a recession, MTD is unlikely to experience a significant or sustained correction in pricing. Whether an investor is seeking outsized returns or downside protection, MTD is a compelling proposition. |
|
|
Capital Pouring Into MTD

|
Commercial Real Estate Leader

|
|
|
 |
|
|

Comments are closed